I am experimenting JFreeChart 1.0.19 for our company.
It seems a mature and stable library that suits very well to our needs.
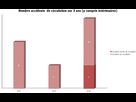
I generated this simple chart :

My only issue is that I don't find how to remove the "borders" on the bottom and the left of the chart.
Any tip ?
Code: Select all
package com.vinci.jfreechart.test;

import java.awt.Color;
import java.awt.Dimension;
import java.awt.Font;

import org.jfree.chart.ChartFactory;
import org.jfree.chart.ChartPanel;
import org.jfree.chart.JFreeChart;
import org.jfree.chart.axis.CategoryAxis;
import org.jfree.chart.axis.ValueAxis;
import org.jfree.chart.block.BlockBorder;
import org.jfree.chart.labels.ItemLabelAnchor;
import org.jfree.chart.labels.ItemLabelPosition;
import org.jfree.chart.labels.StandardCategoryItemLabelGenerator;
import org.jfree.chart.labels.StandardCategoryToolTipGenerator;
import org.jfree.chart.plot.CategoryPlot;
import org.jfree.chart.plot.PlotOrientation;
import org.jfree.chart.renderer.category.StackedBarRenderer3D;
import org.jfree.chart.title.LegendTitle;
import org.jfree.data.category.DefaultCategoryDataset;
import org.jfree.ui.ApplicationFrame;
import org.jfree.ui.RectangleEdge;
import org.jfree.ui.RefineryUtilities;
import org.jfree.ui.TextAnchor;

public class NombreAccidentsSur3Ans extends ApplicationFrame {
	private static final long serialVersionUID = -8625975218180144099L;

	public NombreAccidentsSur3Ans(final String title) {
        super(title);

		final DefaultCategoryDataset dataset = new DefaultCategoryDataset();
		dataset.addValue(1, "Accident mortel", "2012");
		dataset.addValue(1, "Accident de travail", "2012");

		dataset.addValue(0, "Accident mortel", "2013");
		dataset.addValue(2, "Accident de travail", "2013");

		dataset.addValue(0, "Accident mortel", "2014");
		dataset.addValue(1, "Accident de travail", "2014");

		JFreeChart chart = ChartFactory.createStackedBarChart3D(
			"Nombre accidents sur 3 ans (y compris intérimaires)", //Chart Title
			"", // label axe horizontal
			"", // label axe vertical
			dataset, //Data
			PlotOrientation.VERTICAL, //Orientation
			true, //Include Legend
			true, //Tooltips
			false //Urls
		);

		CategoryPlot plot = chart.getCategoryPlot();
		plot.setRangeGridlinesVisible(false);
		plot.setOutlineVisible(false);
		plot.setBackgroundPaint(Color.WHITE);

		CategoryAxis abscisse = plot.getDomainAxis();
		abscisse.setAxisLineVisible(false);
		abscisse.setMinorTickMarksVisible(false);
		abscisse.setTickMarksVisible(false);
		abscisse.setTickLabelsVisible(false);

		ValueAxis ordonnee = plot.getRangeAxis();
		ordonnee.setAxisLineVisible(false);
		ordonnee.setMinorTickMarksVisible(false);
		ordonnee.setTickMarksVisible(false);
		ordonnee.setTickLabelsVisible(false);

		StackedBarRenderer3D r = (StackedBarRenderer3D) plot.getRenderer();
		r.setMaximumBarWidth(0.1);
		r.setBaseItemLabelsVisible(true);
		r.setBaseItemLabelGenerator(new StandardCategoryItemLabelGenerator());
		r.setBaseToolTipGenerator(new StandardCategoryToolTipGenerator());
		ItemLabelPosition labelPosition = new ItemLabelPosition(ItemLabelAnchor.CENTER, TextAnchor.CENTER);
		r.setSeriesPositiveItemLabelPosition(0, labelPosition);
		r.setSeriesPositiveItemLabelPosition(1, labelPosition);
		r.setSeriesItemLabelPaint(0, Color.WHITE);
		r.setSeriesItemLabelPaint(1, Color.WHITE);
		Font font = new Font(Font.SANS_SERIF, Font.BOLD, 14);
		r.setSeriesItemLabelFont(0, font);
		r.setSeriesItemLabelFont(1, font);

		final Color gp0 = new Color(238, 144, 66);
		final Color gp1 = new Color(127, 146, 179);
        r.setSeriesPaint(0, gp0);
        r.setSeriesPaint(1, gp1);

        chart.setBorderVisible(false);
		chart.setAntiAlias(true);
		chart.setTextAntiAlias(true);
		LegendTitle legend = chart.getLegend();
		legend.setPosition(RectangleEdge.RIGHT);
		legend.setFrame(BlockBorder.NONE);

		// add the chart to a panel...
        final ChartPanel chartPanel = new ChartPanel(chart);
        chartPanel.setPreferredSize(new Dimension(1000, 700));
        setContentPane(chartPanel);
	}

	public static void main(String[] args) {

		   final NombreAccidentsSur3Ans demo = new NombreAccidentsSur3Ans("Overlaid Bar Chart Demo");
	        demo.pack();
	        RefineryUtilities.centerFrameOnScreen(demo);
	        demo.setVisible(true);

	}
}Sorry for bad english