Code: Select all
DefaultStatisticalCategoryDataset dataset = new DefaultStatisticalCategoryDataset();
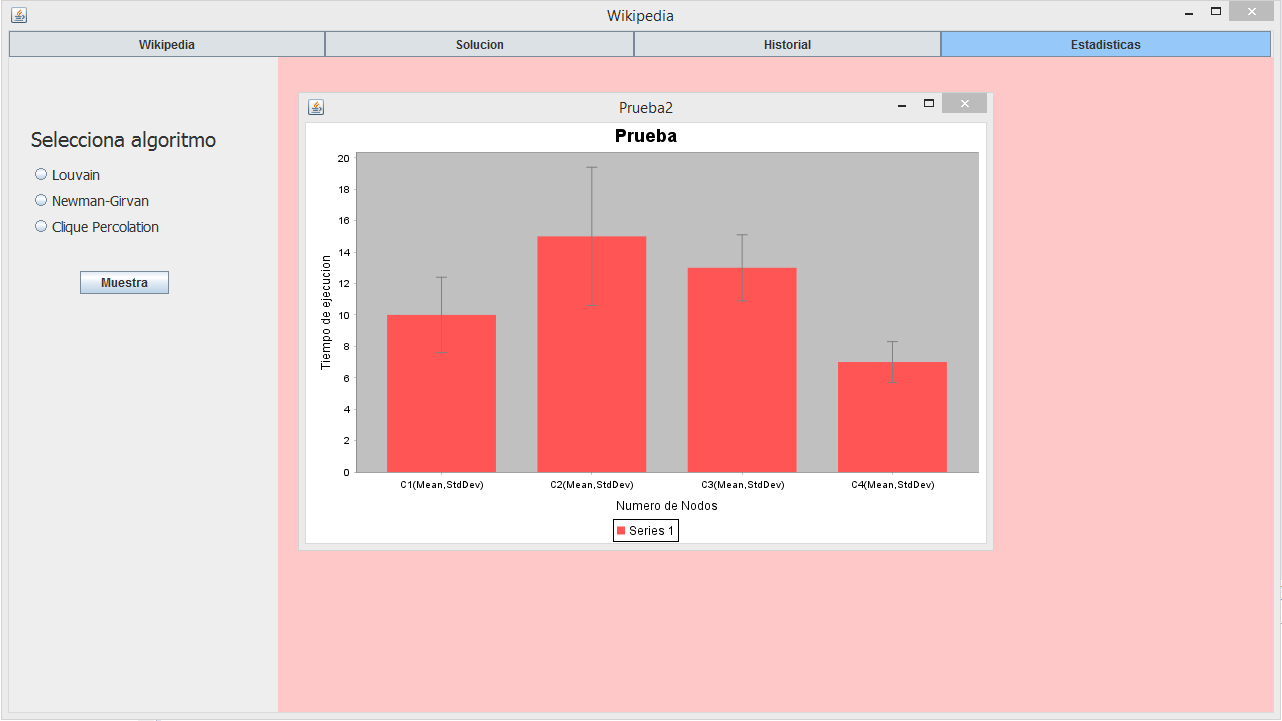
dataset.add(10.0, 2.4, "Series 1", "C1(Mean,StdDev)");
dataset.add(15.0, 4.4, "Series 1", "C2(Mean,StdDev)");
dataset.add(13.0, 2.1, "Series 1", "C3(Mean,StdDev)");
dataset.add(7.0, 1.3, "Series 1", "C4(Mean,StdDev)");
JFreeChart chart = ChartFactory.createLineChart(
"Stadisticas del programa", // chart title
"Tiempo Ejecucion", // domain axis label
"Numero de nodos", // range axis label
dataset, // data
PlotOrientation.VERTICAL, // orientation
true, // include legend
true, // tooltips
false // urls
);
chart.setBackgroundPaint(Color.white);
CategoryPlot plot = (CategoryPlot) chart.getPlot();
plot.setBackgroundPaint(Color.lightGray);
plot.setRangeGridlinePaint(Color.white);
NumberAxis rangeAxis = (NumberAxis) plot.getRangeAxis();
rangeAxis.setStandardTickUnits(NumberAxis.createIntegerTickUnits());
rangeAxis.setAutoRangeIncludesZero(true);
//Here comes my problem, because I can't find the way to display it
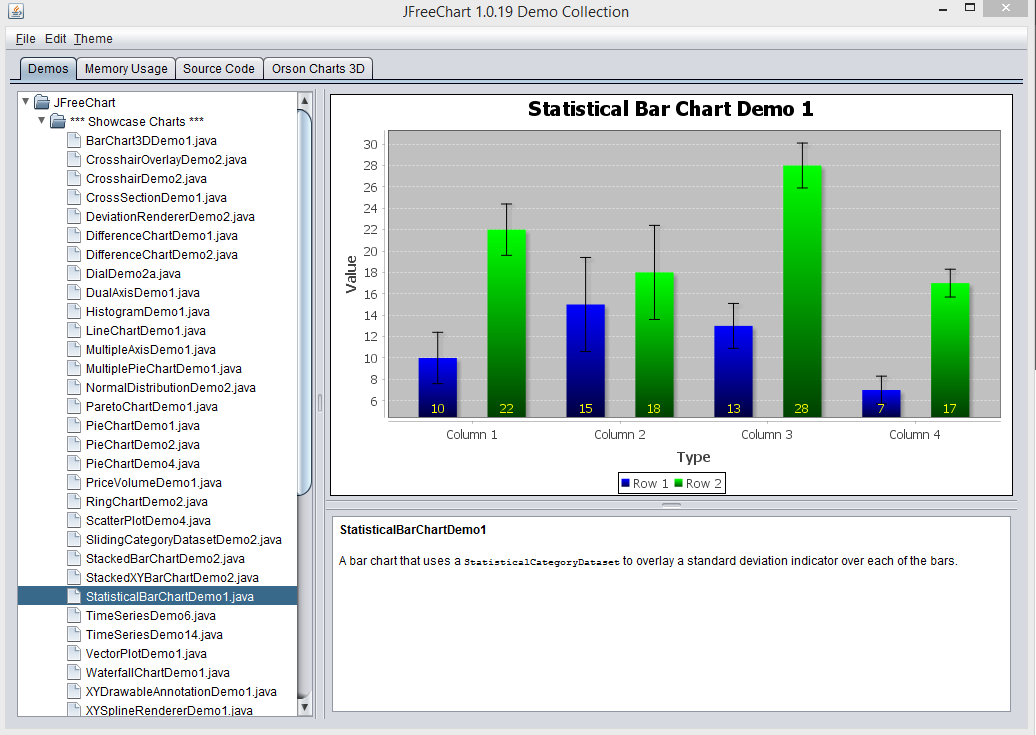
BarChartDemo1 frame = new BarChartDemo1("Hello");
frame.pack();
RefineryUtilities.centerFrameOnScreen(frame);
frame.setVisible(true);
If someone could help me with this, I would greatly appreciate.