how can i make 1 value at center between 2 zeros in chart

A discussion forum for JFreeChart (a 2D chart library for the Java platform).
Locked
nasr25
Posts: 8
Joined: Mon Jun 15, 2015 6:01 am
antibot: No, of course not.

how can i make 1 value at center between 2 zeros in chart

Post by nasr25 » Mon Jun 15, 2015 11:32 am

Hi

i have program show some reading in chart

but i need to make my chart from -0 - +0 and value 1 in the center , like this picture :

Image

how can i make it using jfree chart library, can u give example ?

thanks

nasr25
Posts: 8
Joined: Mon Jun 15, 2015 6:01 am
antibot: No, of course not.

Re: how can i make 1 value at center between 2 zeros in char

Post by nasr25 » Sun Jul 26, 2015 9:06 am

where is developer ???????????

paradoxoff
Posts: 1634
Joined: Sat Feb 17, 2007 1:51 pm

Re: how can i make 1 value at center between 2 zeros in char

Post by paradoxoff » Sun Jul 26, 2015 6:43 pm

Have you looked at the SymbolAxis class?
If the "yellow" data points have y values around 0, and the "red" data points have y values around 4, you could use a SymbolAxis ad range axis with the following Strings:
"-0","-0.5","1","+0.5", "+0".
If that is not what you need, you should explain the background a bit more. Mathematically, +0 and -0 are equivalent, so I wonder how you decide whether a data point with a y value or zero should appear at the "-0" or the "+0" level.

nasr25
Posts: 8
Joined: Mon Jun 15, 2015 6:01 am
antibot: No, of course not.

Re: how can i make 1 value at center between 2 zeros in char

Post by nasr25 » Mon Jul 27, 2015 7:09 am

thanks for replay

i need to chart like :

Image

but i need from -0,-0.5,1,+0.5,+0

some time i have value -0.3 , that mean line under value number 1 , and if my value is +0.3 that mean line up of value number 1

that my question

thanks

paradoxoff
Posts: 1634
Joined: Sat Feb 17, 2007 1:51 pm

Re: how can i make 1 value at center between 2 zeros in char

Post by paradoxoff » Mon Jul 27, 2015 1:06 pm

I still don´t get it.
I can imagine that the scales of the shown device extends on both the lead and the lag side to successively lower values, i.e. from 1 to 0.5, further to 0, and then to -0.5 to finally arrive at -11. In that case, I would recommend to create a dataset with two series, one for the "lag" data, one for the "lead", both with a range between -1 and 1.
But I have no idea how the device would look like if it had the order of values that you have mentioned (-0,-0.5,1,+0.5,+0). That doesn't make sense, and is different from what is shown on the device.
And you haven´t ansered my question: If the y coordinate of a value happens to be 0, should it appear at the top or at the bottom of the chart?
Where does the chart in your screenshot come from? Does it come from a different charting tool? If yes, how do the data look like?
Last edited by paradoxoff on Thu Jul 30, 2015 9:41 am, edited 1 time in total.

John Matthews
Posts: 513
Joined: Wed Sep 12, 2007 3:18 pm

Re: how can i make 1 value at center between 2 zeros in char

Post by John Matthews » Wed Jul 29, 2015 10:59 pm

See also power factor, pictured here. I see that the deviation of the needle from vertical is +/- the arccos(value). I'm guessing a custom DialScale might work, but I've not tried.

nasr25
Posts: 8
Joined: Mon Jun 15, 2015 6:01 am
antibot: No, of course not.

Re: how can i make 1 value at center between 2 zeros in char

Post by nasr25 » Tue Aug 18, 2015 7:27 am

i need like this picture :

Image

how determine Y axis like photo : -0 -0.5 1 0.5 0

any assistants

paradoxoff
Posts: 1634
Joined: Sat Feb 17, 2007 1:51 pm

Re: how can i make 1 value at center between 2 zeros in char

Post by paradoxoff » Tue Aug 18, 2015 8:12 am

Have you even read one of the above comments?

nasr25
Posts: 8
Joined: Mon Jun 15, 2015 6:01 am
antibot: No, of course not.

Re: how can i make 1 value at center between 2 zeros in char

Post by nasr25 » Tue Aug 18, 2015 8:59 am

Yes
But I want code example or link to good tutorial

paradoxoff
Posts: 1634
Joined: Sat Feb 17, 2007 1:51 pm

Re: how can i make 1 value at center between 2 zeros in char

Post by paradoxoff » Tue Aug 18, 2015 10:39 am

As mentioned above, I still don´t understand the meaning of the chart, most importantly, the apparent difference between 0 and -0 (though these values are mathematically equivalent), and the odd order of the data values, which is different from the order in the meter device.

John Matthews
Posts: 513
Joined: Wed Sep 12, 2007 3:18 pm

Re: how can i make 1 value at center between 2 zeros in char

Post by John Matthews » Tue Aug 18, 2015 12:46 pm

paradoxoff: In this context, I think the sign of the range values is the sign of the phase angle between the current and voltage, a complex quantity. Negative values would represent the voltage "lagging" the current, while positive values represent the voltage "leading" the current.

nasr25: I'm guessing that this would require new kind of NumberAxis; one of the known subclasses might serve as an example of how you'd go about subclassing NumberAxis to get the desired appearance.

paradoxoff
Posts: 1634
Joined: Sat Feb 17, 2007 1:51 pm

Re: how can i make 1 value at center between 2 zeros in char

Post by paradoxoff » Tue Aug 18, 2015 2:01 pm

John: Thanks for the explanation, but I think that I understood that part (I might be wrong, though).
As explained in one of the posts above, I can imagine a signal with a maximum value of 1 that is going to lower and lower values, e.g. from 1 to 0.5, 0,-0.5 to arrive at a minimum value of -1.
But the order of values that nasr25 has specified and that are shown on the chart (-0, -0.5, 1, 0.5, +0) don´t make sense to me.
Its easily possible that I have avoided complex numbers for a too long time.

John Matthews
Posts: 513
Joined: Wed Sep 12, 2007 3:18 pm

Re: how can i make 1 value at center between 2 zeros in char

Post by John Matthews » Wed Aug 19, 2015 12:54 pm

paradoxoff: Sorry for the hand-waving about complex numbers; I vaguely recall 
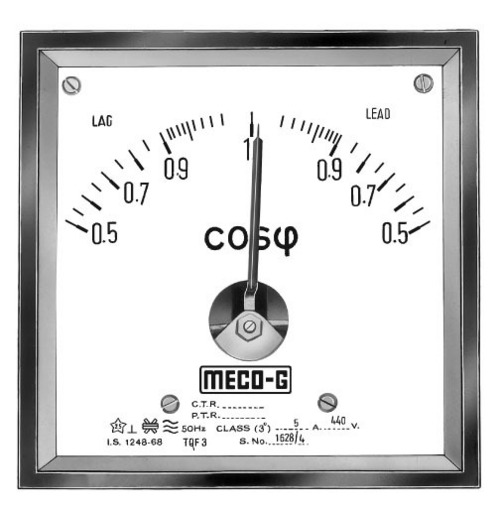
this connection between cosine and the unit circle for complex values. The net effect is that you are correct: valid values of the cosine of the phase angle are in the interval -1..1, as shown here. Assuming a left edge display having 1 appearing in the middle, negative values in the interval -1..0 would be mapped to the lower half in decreasing order by absolute value from 1 down to 0, while positive values in the interval 0..1 would be mapped to the top half also in decreasing order from 1 up to 0. I'm thinking that this could be handled in a subclass of ValueAxis, say PhaseAxis, in the implementations of java2DToValue and valueToJava2D. I'm hopeful that an existing implementation of XYItemRenderer could use such an axis without change, but a new renderer might be required.

Locked