please have a look at the following picture below as I try to describe my problem.
My dataset consits of 3 dimensions: [measure value, measure count, timestamp]
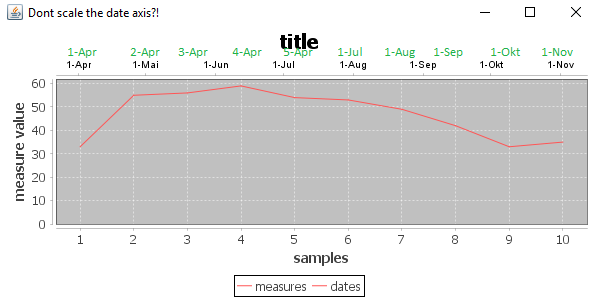
I want to create a graph over all measure values where my main x axis shows the measure count. A seconds x axis should give a rough overview over the dates when the measure were taken.
The measure count is a simple sequence counter where the next value is always incremented by one. But, the sequence of timestamps is not uniformly incremented. It is possible that each day a measure was taken but for some time only each month (as shown in the example by the green date ticks).
If I add my second x axis in JFreechart to my plot the sequence of the dates are not uniformly "scaled" along the measure counter. ( in the example pciture the black date ticks)
Again, black date ticks is what I get with the current code and the green date ticks (which I added manually) is what it actually should look like.
Can anybody help me out on this issues? I much appreciate.
Cheers
Here is my code example to generate the example plot.
Code: Select all
import java.awt.Color;
import java.text.SimpleDateFormat;
import java.util.Calendar;

import javax.swing.JPanel;

import org.jfree.chart.ChartFactory;
import org.jfree.chart.ChartPanel;
import org.jfree.chart.JFreeChart;
import org.jfree.chart.axis.AxisLocation;
import org.jfree.chart.axis.DateAxis;
import org.jfree.chart.plot.XYPlot;
import org.jfree.data.xy.XYSeries;
import org.jfree.data.xy.XYSeriesCollection;
import org.jfree.ui.ApplicationFrame;
import org.jfree.ui.RefineryUtilities;

/**
 * An example of two time series for different time periods, plotted against each other using two
 * x-axes and two y-axes.
 */
public class JFreeChartEx extends ApplicationFrame {

  /**
   * A demonstration application showing how to create a time series chart with multiple axes.
   *
   * @param title the frame title.
   */
  public JFreeChartEx(String title) {
    super(title);
    JPanel chartPanel = createDemoPanel();
    chartPanel.setPreferredSize(new java.awt.Dimension(600, 270));
    setContentPane(chartPanel);

  }

  private static JFreeChart createChart() {

    int[] samples = new int[] {1, 2, 3, 4, 5, 6, 7, 8, 9, 10};
    int[] measures = new int[] {33, 55, 56, 59, 54, 53, 49, 42, 33, 35};
    long[] timepoints = createTimepoints();


    XYSeriesCollection dataset1 = new XYSeriesCollection();
    XYSeriesCollection dataset2 = new XYSeriesCollection();
    XYSeries series1 = new XYSeries("measures");
    XYSeries series2 = new XYSeries("dates");
    dataset1.addSeries(series1);
    dataset2.addSeries(series2);

    for (int i = 0; i < samples.length; i++) {
      series1.add(samples[i], measures[i]);
      series2.add(timepoints[i], measures[i]);
    }

    JFreeChart chart =
        ChartFactory.createXYLineChart("title", "samples", "measure value", dataset1);

    chart.setBackgroundPaint(Color.white);
    XYPlot plot = (XYPlot) chart.getPlot();

    DateAxis xAxis1 = new DateAxis();
    xAxis1.setDateFormatOverride(new SimpleDateFormat("d-MMM"));
    plot.setDataset(1, dataset2);
    plot.mapDatasetToDomainAxis(1, 1);
    plot.mapDatasetToRangeAxis(1, 1);
    plot.setDomainAxis(1, xAxis1);
    plot.setDomainAxisLocation(1, AxisLocation.TOP_OR_LEFT);

    return chart;

  }

  private static long[] createTimepoints() {
    Calendar cal = Calendar.getInstance();
    cal.set(Calendar.YEAR, 2016);
    cal.set(Calendar.MONTH, Calendar.APRIL);
    cal.set(Calendar.DAY_OF_MONTH, 1);

    // first 5 instances are same month
    long[] timepoints = new long[10];
    for (int i = 0; i < 5; i++) {
      cal.set(Calendar.DAY_OF_MONTH, i+1);
      timepoints[i] = cal.getTimeInMillis();
      System.out.println(cal.getTime());
    }
    // last 5 instances are different months
    cal.set(Calendar.DAY_OF_MONTH, 1);
    for (int i = 5; i < 10; i++) {
      cal.set(Calendar.MONTH, (i+1));
      timepoints[i] = cal.getTimeInMillis();
      System.out.println(cal.getTime());
    }
    return timepoints;
  }

  /**
   * Creates a panel for the demo (used by SuperDemo.java).
   *
   * @return A panel.
   */
  public static JPanel createDemoPanel() {
    JFreeChart chart = createChart();
    return new ChartPanel(chart);
  }

  /**
   * Starting point for the demonstration application.
   *
   * @param args ignored.
   */
  public static void main(String[] args) {

    JFreeChartEx demo = new JFreeChartEx("Dont scale the date axis?!");
    demo.pack();
    RefineryUtilities.centerFrameOnScreen(demo);
    demo.setVisible(true);

  }

}