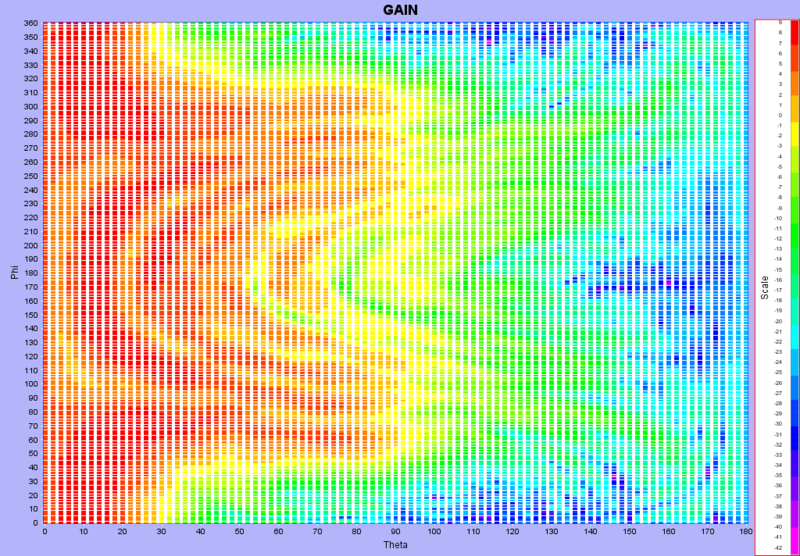
Larger chart:
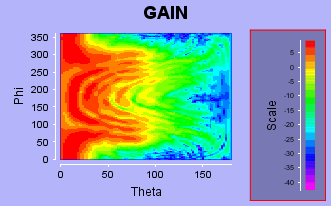
Small chart:
Here's a sample of my code to create the chart...
Code: Select all
public JFreeChart createChart(XYZDataset dataset) {
        NumberAxis xAxis = new NumberAxis("Theta");
        xAxis.setStandardTickUnits(NumberAxis.createIntegerTickUnits());
        xAxis.setLowerMargin(0.0);
        xAxis.setUpperMargin(0.0);
        xAxis.setAxisLinePaint(Color.white);
        xAxis.setTickMarkPaint(Color.white);

        NumberAxis yAxis = new NumberAxis("Phi");
        yAxis.setStandardTickUnits(NumberAxis.createIntegerTickUnits());
        yAxis.setLowerMargin(0.0);
        yAxis.setUpperMargin(0.0);
        yAxis.setAxisLinePaint(Color.white);
        yAxis.setTickMarkPaint(Color.white);

        XYBlockRenderer renderer = new XYBlockRenderer();
        LookupPaintScale paintScale = new LookupPaintScale(min, max,
                Color.gray);
	//code adding paints to paintScale
        renderer.setPaintScale(paintScale);

        XYPlot plot = new XYPlot(dataset, xAxis, yAxis, renderer);
        plot.setBackgroundPaint(Color.lightGray);
        //plot.setDomainGridlinesVisible(false);
        plot.setRangeGridlinePaint(Color.white);
        plot.setAxisOffset(new RectangleInsets(5, 5, 5, 5));
        plot.setOutlinePaint(Color.blue);
        JFreeChart chart = new JFreeChart(patternType.toUpperCase(), plot);
        chart.removeLegend();
        NumberAxis scaleAxis = new NumberAxis("Scale");
        scaleAxis.setAxisLinePaint(Color.white);
        scaleAxis.setTickMarkPaint(Color.white);
        scaleAxis.setTickLabelFont(new Font("Dialog", Font.PLAIN, 7));
        scaleAxis.setRange(min, max);
        PaintScaleLegend legend = new PaintScaleLegend(paintScale,
                scaleAxis);
        legend.setAxisLocation(AxisLocation.BOTTOM_OR_LEFT);
        legend.setAxisOffset(5.0);
        legend.setMargin(new RectangleInsets(5, 5, 5, 5));
        legend.setFrame(new BlockBorder(Color.red));
        legend.setPadding(new RectangleInsets(10, 10, 10, 10));
        legend.setStripWidth(10);
        legend.setPosition(RectangleEdge.RIGHT);
        legend.setBackgroundPaint(new Color(120, 120, 180));
        chart.addSubtitle(legend);
        chart.setBackgroundPaint(new Color(180, 180, 250));
        return chart;
    }