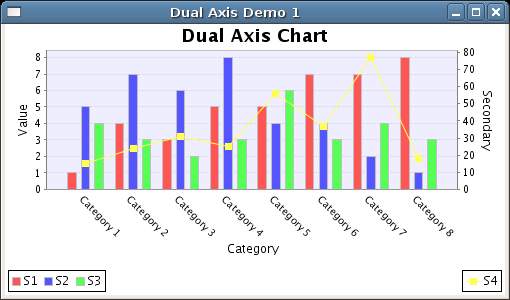
I have an XYPlot XYSeries dataset and both range and domain axis are of type NumberAxis. I want to make the XAxis (domain axis) slant and rotated towards either right or left. When I set it to verical it is just 180degrees (PI radians). How to specify an angle so my TickMark Lables are slanted. Similar to this slantted graph example;
However, I want it for XYPlot & XYSeries dataset and I want the vertical tickmark lines inaddition to slanted label. and there aren't any dual axis either.
Thanks.