i have the following problem with the SpiderWebPlot:
I am using the SpiderWebPlot as a Kiviat Diagramm in which I show different indexes.
These indexes ( 5 different types) are always between 0 and 1. How to adjust this is no problem.
Code: Select all
spider.setMaxValue(0.99);What I would need are some lines, e.g. for 0.25, 0.5, 0.75 and 1.0 or point on the graph should have a label with it's index-value.
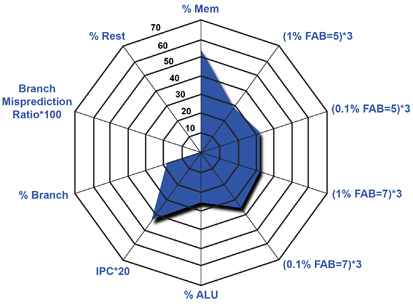
To show your graphically what I mean...
First what I have:
 ,
,and what I need:
I tried my best with the polarchart, but there you can't have axis with Strings, only with Integers.