A discussion forum for JFreeChart (a 2D chart library for the Java platform).
-
gustavo_mesquita
- Posts: 1
- Joined: Tue Nov 28, 2017 2:54 am
- antibot: No, of course not.
Post
by gustavo_mesquita » Tue Nov 28, 2017 4:31 pm
Hi all,
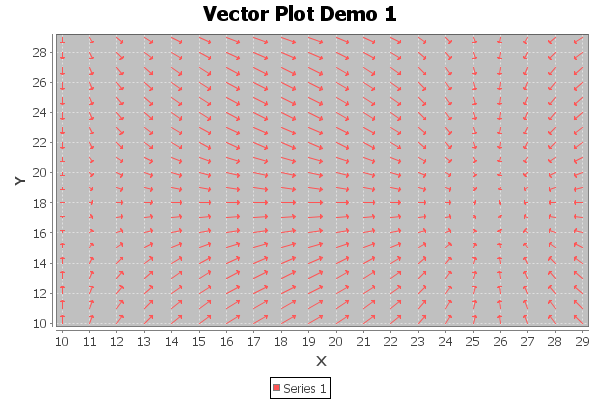
I would like to represent sea currents on my chart. The Vector Plot Demo 1 shows de best way to do it, I think so.
The parameters are: date, hour, magnitude [m/s] and direction [0-360].
I need to show the date on Y axis and the time (0 to 23) on X axis. I have a plot that can ben seen in example below generated in another plot tool.
 How can I use the deltaX and DeltaY from VectorSeries.add() method to plot a chart as shown in VectorPlotDemo1.java below?
Thanks in advance.
-
paradoxoff
- Posts: 1634
- Joined: Sat Feb 17, 2007 1:51 pm
Post
by paradoxoff » Wed Nov 29, 2017 10:48 am
The VectorRenderer draw arrows from x,y to x+dx, y+dy. The major issue that I see is that the renderer does the conversion from data space (the dx and dy values) to Java 2D space (the length with which the lines are drawn in the chart) by the domain and range axis. Since the axes represent time, and the length of the arrow should represent the magnitude, this will cause problems.
You might be better of by a) using a WindDataset and a WindItemRenderer or by b) subclassing VectorRenderer, overwrite drawItem, and calculate xx1 and yy1 by driect conversion of the magnitude to a length in Java2D coordinates.