Search found 61 matches
- Wed Jul 02, 2014 12:58 pm
- Forum: JFreeChart
- Topic: StackedXYAreaChart with strange lines
- Replies: 5
- Views: 8668
Re: StackedXYAreaChart with strange lines
hi David thanks for you anwser. It is ok now but i need your helps please here are my codes: could you tell me if it is well done? thanks a lot XYSeries xyseries1 = new XYSeries("serie 1", true, false); // idem for 2,3,4 // add valeu to xyserie1, 2, 3, 4 DefaultTableXYDataset defautDataSet = new Def...
- Wed Jul 02, 2014 9:53 am
- Forum: JFreeChart
- Topic: StackedXYAreaChart with strange lines
- Replies: 5
- Views: 8668
StackedXYAreaChart with strange lines
Hi
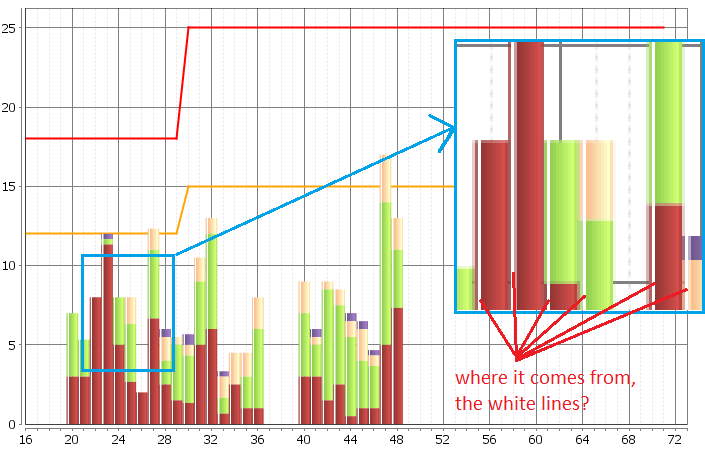
- my chart is a StackedXYAreaChart one
but I don't understard why it has the white vertical lines ...
thanks a lot
best regards
- my chart is a StackedXYAreaChart one
but I don't understard why it has the white vertical lines ...
thanks a lot
best regards
- Tue Jul 01, 2014 12:11 pm
- Forum: JFreeChart
- Topic: stacked bar chart with line chart
- Replies: 3
- Views: 6048
Re: stacked bar chart with line chart
got solution with createStackedXYAreaChart
(bad idea with StackedBarChart)
(bad idea with StackedBarChart)
- Mon Jun 30, 2014 3:13 pm
- Forum: JFreeChart
- Topic: stacked bar chart with line chart
- Replies: 3
- Views: 6048
Re: stacked bar chart with line chart
it is OK for range axis but not for domain axis (tried with categoryplot.mapDatasetToDomainAxis(1, 0);) as you see on the above chart, i have 2 lines: - line1 : from XY(16,12) to (29,12) and up to (30,15) and pass to (66,15) - line2 : from XY(16,18) to (29,18) and up to (30,25) and pass to (66,25) h...
- Mon Jun 30, 2014 10:37 am
- Forum: JFreeChart
- Topic: stacked bar chart with line chart
- Replies: 3
- Views: 6048
stacked bar chart with line chart
Hi please tell me how cound i make the following chart http://nguyenduchai.free.fr/temp/jfreechart/graph20160630.JPG - only range axis on the left (no range axis on the right) - i can't use the marker for the line because it isn't horizontal :( - i looked the DualAxisDemo1 but it has the secondary a...
- Wed Sep 28, 2011 7:02 am
- Forum: JFreeChart
- Topic: rang Axis X & tickLabel
- Replies: 5
- Views: 7343
Re: rang Axis X & tickLabel
http://nguyenduchai.free.fr/jfreechart/TimeSeriesChart2.JPG I do it with following code: if (periode_id.equals("month")) { // month dateaxis.setTickUnit(new DateTickUnit(DateTickUnit.MONTH, 1, new SimpleDateFormat(pPERIODE_FORMAT1))); // Deprecated. As of version 1.0.13, use DateTickUnitType instea...
- Tue Sep 27, 2011 7:07 pm
- Forum: JFreeChart
- Topic: TimeSeries override x-axis unit
- Replies: 5
- Views: 7855
Re:
Wow, thanks for your fast help! :D I've had to be blind to miss that... :shock: String[] quarters={"1. Quartal", "2. Quartal", "3. Quartal", "4. Quartal"}; axis.setDateFormatOverride(new QuarterDateFormat(TimeZone.getDefault(),quarters)); unit=new DateTickUnit(DateTickUnit.MONTH, 3,new QuarterDateF...
- Tue Sep 27, 2011 11:13 am
- Forum: JFreeChart
- Topic: rang Axis X & tickLabel
- Replies: 5
- Views: 7343
Re: rang Axis X & tickLabel
hi paradoxoff do you know why the format ww/yyyy of the date '01/01/2010' gave 53/2010 and not '53/2009' ? http://nguyenduchai.free.fr/jfreechart/TimeSeriesChart.JPG other problem I don't know why I have the same values on DomaineAxis : very strange :( org.jfree.data.time.RegularTimePeriod periodeTe...
- Thu Sep 22, 2011 6:04 pm
- Forum: JFreeChart
- Topic: rang Axis X & tickLabel
- Replies: 5
- Views: 7343
rang Axis X & tickLabel
Hi on a axis, how can I change the tickLabel that are diffents from the real values? my Axis X is based on date of year that have 3 possibles: - week (1 -> 52 or 53) - month (1 -> 12) - quarter (1 -> 4) the problem occurs if the rangs are over on 2 years for ex: the rang is from 01/12/2010 to 05/03/...
- Mon May 17, 2010 12:42 pm
- Forum: JFreeChart
- Topic: ServletUtilites.saveChartAsPNG question
- Replies: 6
- Views: 8000
Re: ServletUtilites.saveChartAsPNG question
or we can build a method "setStoredDirectory(String dir)" in ServletUtilities
- Mon May 17, 2010 8:29 am
- Forum: JFreeChart
- Topic: ServletUtilites.saveChartAsPNG question
- Replies: 6
- Views: 8000
Re: ServletUtilites.saveChartAsPNG question
Hi David
i think that it's better/flexible if we can set the directory stored the chart (actually, it's System.getProperty("java.io.tmpdir") such as a parametre of the servlet
best regards
BO
i think that it's better/flexible if we can set the directory stored the chart (actually, it's System.getProperty("java.io.tmpdir") such as a parametre of the servlet
best regards
BO
- Thu Oct 22, 2009 9:50 pm
- Forum: JFreeChart
- Topic: Title and SubTitle of chart
- Replies: 5
- Views: 6265
Re: Title and SubTitle of chart
David
could u show to me some snippe codes please ?
I have tried but i did not work
(all of subtitles are in the middle , not left - middle - right)
thanks very much
@+
could u show to me some snippe codes please ?
I have tried but i did not work
(all of subtitles are in the middle , not left - middle - right)
thanks very much
@+
- Thu Oct 22, 2009 9:16 pm
- Forum: JFreeChart
- Topic: Title and SubTitle of chart
- Replies: 5
- Views: 6265
Re: Title and SubTitle of chart
i wonder if i could add the 3th sub-title on the middle, and set invisible the main title of chart ...
- Thu Oct 22, 2009 8:41 pm
- Forum: JFreeChart
- Topic: Title and SubTitle of chart
- Replies: 5
- Views: 6265
Title and SubTitle of chart
hi
I need to show one subtitle st1 on the left, one subttile st2 on the right
and the title of chart is on the same line like 2nd chart following:

how could I do it ?
thanks
regards
BO
I need to show one subtitle st1 on the left, one subttile st2 on the right
and the title of chart is on the same line like 2nd chart following:
how could I do it ?
thanks
regards
BO
- Wed Oct 14, 2009 4:28 am
- Forum: JFreeChart
- Topic: Axis X & Tick on the XYLineChart chart
- Replies: 4
- Views: 5605
Re: Axis X & Tick on the XYLineChart chart
hi I have found one simple solution: new NumberTickUnit( 1, new DecimalFormat("0 ")); (there are some " " in the format of NumberTickUnit) http://nguyenduchai.free.fr/jfreechart/jfreechart_XYLineChart1.JPG but now I want to not show zero ... I dit setAutoRangeIncludesZero(false); but it didn't work ...