I am needing to build a chart that displays data by state for each month. The data layout coming back from the database looks like this...
state jan feb mar apr may jun jul aug sep oct nov dec
ARKANSAS null null null null null null null null null 1 null 73
KANSAS null null null null null null null null 8 20 18 20
MISSOURI null null null null null null null 3 17 34 37 26
OKLAHOMA null null null null null null null null 9 19 18 13
TEXAS null null null null 4 null null 19 149 556 606 627
Total null null null null 4 null null 22 183 630 679 759
ZDA Target 0 0 27 55 191 273 273 327 354 409 409 409
I would like it the out put to be in a stacked bar fomat...any suggestions??
Thanks-
EP
Best approach
Hi
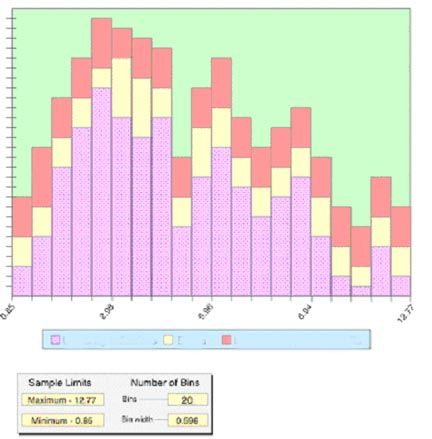
can you let me know how you did this? I am also trying to implement a stacked histogram. like this:
but end up getting this:
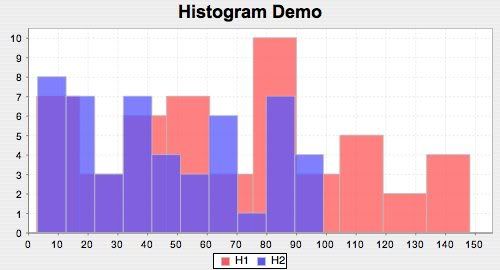
I used the HistogramDemo to do this example. I have two double [] arrays, and add each to the dataset, with the number of bins. The first array contains random numbers from 0-150, and the second one 0-100. So instead of being stacked, I get this picture, that looks like 2 seperate histograms in one graph..
can you let me know how you did this? I am also trying to implement a stacked histogram. like this:
but end up getting this:
I used the HistogramDemo to do this example. I have two double [] arrays, and add each to the dataset, with the number of bins. The first array contains random numbers from 0-150, and the second one 0-100. So instead of being stacked, I get this picture, that looks like 2 seperate histograms in one graph..
Well, I thought of using stacked bar chart (instead of histogram and/or histogram dataset), and then doing the histogram calculations myself and putting the results into an array that has the same number of elements as the set number of bins.
But its really getting messy for a few reasons... one is that a user specifies what variables they want to see graphed, and that could range from 1-5. and there has to be an option for the user to change the number of bins, and then the graph should refresh and redraw according to that.
I wish I could get in touch with you eap, but there seems to be no option for me to email or pm.