In a dual-axes chart, can I make two range axis ticks that from the two axes respectively share one grid line?
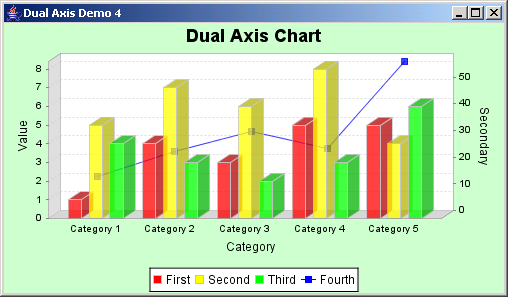
For instance, as shown as the following chart,
I wish Value axis tick "3" and Secondary axis tick "20" could locate at the same Y-axis location.
How to do?
Thanks!