Blcok chart with DateAxis vs NumberAxis

A discussion forum for JFreeChart (a 2D chart library for the Java platform).
Locked
kirrr
Posts: 3
Joined: Wed Apr 14, 2010 9:27 pm
antibot: No, of course not.

Blcok chart with DateAxis vs NumberAxis

Post by kirrr » Thu Apr 15, 2010 11:41 am

Hi!

Thanks a lot for the JFreeChart, it is really amazing!
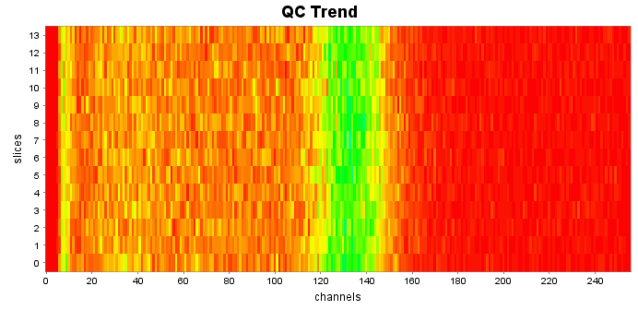
I am using it to create a block chart like this using an XYZDataset, XYBlockRenderer and XYPlot (each row is a spectrum acquired every twelve hours):
Image

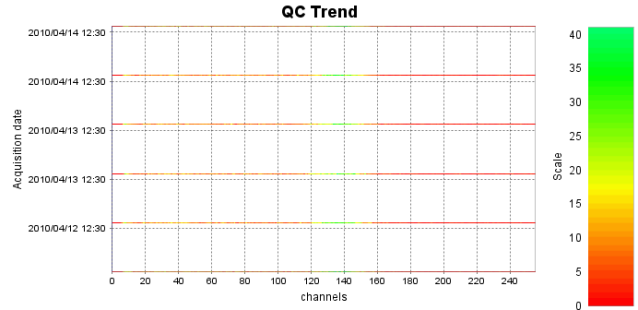
but then I wanted to change the Y axis to display the acquisition time of the spectra and not just it's ID. So I have changed the YAxis from NumberAxis to DateAxis and the y values in the dataset to milliseconds (and I have also added a PaintScaleLegend for the SclaeAxis, thanks for the tip in one of the posts in this forum http://www.jfree.org/phpBB2/viewtopic.php?f=3&t=29922). But now the chart looks like this:
Image

I don't understand why has it changed that way and how can I make it look like it was before. Any suggestions?

Here is the code for the yAxis before:

Code: Select all

   
NumberAxis yAxis = new NumberAxis("slices");
yAxis.setStandardTickUnits(NumberAxis.createIntegerTickUnits());
yAxis.setLowerMargin(0.0);
yAxis.setUpperMargin(0.0);
and after:

Code: Select all

DateAxis yAxis = new DateAxis("Acquisition date");
SimpleDateFormat at = new SimpleDateFormat("yyyy/MM/dd hh:mm");
yAxis.setDateFormatOverride(at);
yAxis.setTickUnit(new DateTickUnit(DateTickUnitType.HOUR,12, at));
yAxis.setTickMarkPosition(DateTickMarkPosition.MIDDLE);
yAxis.setLowerMargin(0.0);
yAxis.setUpperMargin(0.0);
Forgot to mention: i am using version 1.0.13

paradoxoff
Posts: 1634
Joined: Sat Feb 17, 2007 1:51 pm

Re: Blcok chart with DateAxis vs NumberAxis

Post by paradoxoff » Fri Apr 16, 2010 6:23 pm

The shapes drawn by an XYBlockRenderer are instances of Rectangle2D.Double whose width and height (in pixel) represent the blockWidth and blockHeight (in data coordinates).
If you set a blockWidth and blockHeight of 1, the size of the Rectangle will thus not span 1x1 pixel but a number of pixels that correspond to a value range of 1 along the x and y axes. If both of your axes span a value range from 0.1 to 0.2, the rectangle will fill up the entire chart.
In your case, the opposite has apparently happened. From the first screenshot, it seems that you have set a blockWidth and blockHeight of 1. This is fine, since both axes span a range of << 1000, and the resulting blocks are larger than 1 pixel along the x and y directions.
After you have changed the y axis to a DateAxis, a blockHeight of 1 will correspond to 1 millisecond which, dependend on the date range of the DateAxis, might easily correspond to less than 1 pixel. This explains the very thin dots. Moreover, since you have not accumulated the data with one data point per millisecond, you have large ranges with no data at all.
Solution: calculate the date range between the thin colored lines on your second screenshot in milliseconds, and use that value for the blockHeight.

kirrr
Posts: 3
Joined: Wed Apr 14, 2010 9:27 pm
antibot: No, of course not.

Re: Blcok chart with DateAxis vs NumberAxis

Post by kirrr » Fri Apr 16, 2010 10:01 pm

Thanks for your answer! Now it works fine!!! I have added

Code: Select all

renderer.setBlockHeight(12*60*60*1000);
for the 12 hours as you have suggested.

(Please disregard the previous edition of this post, it was my mistake, I have screwed up the dataset while editing and it was producing strange results)

Locked