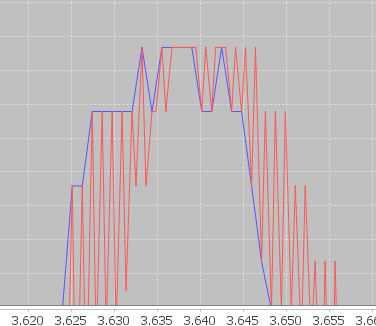
I am new to Java but completely new to JFreeChart. It looks great and exactly what I am looking for. For a project I am trying to present database data in a graph. In the example below I use additional classes to connect and retrieve the data and in the section below I forward it into a XYLineChart. Unfortunately the two series are not shown as 2 independent lines. For some reason, the second dataset seems to draw lines to the first dataset points. The X-values of the series do not match.
How can I prevent this to happen? What am I doing wrong? The queries I use do return the appropriate data.
My second question concerns the use of JDBCXYDataset. This makes it a lot easier to collect the data directly from the database, but returns the information as a dataset. I do not know how to combine two datasets so that they can be shown in one XY Line Chart as 2 separate lines.
Thanks in advance for any suggestions!
Cheers Peter
Code: Select all
public class test {


	public static void main(String[] args) throws SQLException {

		XYSeriesCollection dataSet = new XYSeriesCollection();
		XYSeries xyserie1 = new XYSeries("2260");
		XYSeries xyserie2 = new XYSeries("2270");
		String query = "SELECT Time, MaxIntensity FROM Frames WHERE MsMsType = '0';";
		HashMap<Double, Double> coordinates1 = new HashMap<Double, Double>();
		coordinates1 = graphData.getGraphData(query, "TMEM199_Shotgun_S5_Inj1_Slot1-05_1_2260.d");
		coordinates1.forEach((key,value) -> xyserie1.add(key, value));

		HashMap<Double, Double> coordinates2 = new HashMap<Double, Double>();
		coordinates2 = graphData.getGraphData(query, "TMEM199_Shotgun_S5_Inj2_Slot1-05_1_2270.d");
		coordinates2.forEach((key,value) -> xyserie2.add(key, value));

		dataSet.addSeries(xyserie2);
		dataSet.addSeries(xyserie1);

		JFreeChart graph = ChartFactory.createXYLineChart("Summed Intensity", "Retention time [sec]", "Summed Ion Intensities [frame^-1]", dataSet );

		ChartFrame frame = new ChartFrame("First", graph);
		frame.pack();
		frame.setVisible(true);
	}
}