Hi,
in my XYPlot of a time series chart I'm using a DateAxis for the domain axis which displays months. I want each month to have a vertical grid line, so I tried using a 1-month TickUnit. However, the tick labels for the months (formatted as "mm/yyyy") will then overlap each other if the width of my chart becomes too small.
When I use auto tick range instead (or the TickUnits class to explicitly specify the larger intervals to use), the chart will use larger intervals if the chart is too small to display all tick labels, but this of course also affects the vertical grid lines, which are drawn with the same interval as the tick labels.
Is it possible to have 1-month vertical grid lines (ticks) with dynamic tick label intervals? If there isn't enough space, the tick labels can have a larger interval (e.g., labels for every 2 or 3 months), but I want vertical grid lines for each month at all times.
Any ideas?
Ticks and tick labels
I managed to hack up a solution by overriding DateAxis.drawTickMarksAndLabels(). The method itself doesn't draw the domain grid lines (only the ticks and tick labels), but returns an AxisState object which contains the list of ticks drawn and which is later passed on to XYPlot.drawDomainGridlines().
This works by returning an AxisState with a modified List of Ticks (one for each month), which will then be used to draw the grid lines.
You can use the class by using
If there are any issues involved with this solution, please let me know.
This works by returning an AxisState with a modified List of Ticks (one for each month), which will then be used to draw the grid lines.
You can use the class by using
Code: Select all
plot.setDomainAxis(new CustomDateAxis());Code: Select all
private class CustomDateAxis extends DateAxis {
       /**
	     * Draws the axis line, tick marks and tick mark labels.
	     *
	     * @param g2  the graphics device.
	     * @param cursor  the cursor.
	     * @param plotArea  the plot area.
	     * @param dataArea  the data area.
	     * @param edge  the edge that the axis is aligned with.
	     *
	     * @return The width or height used to draw the axis.
	     */
	    protected AxisState drawTickMarksAndLabels(Graphics2D g2,
	                                               double cursor,
	                                               Rectangle2D plotArea,
	                                               Rectangle2D dataArea,
	                                               RectangleEdge edge) {

	       AxisState state = super.drawTickMarksAndLabels(g2,cursor,plotArea,dataArea,edge);

            // replace the returned ticks by ticks with interval of 1 month

            // remember old TickUnit
	    	DateTickUnit tickUnit = getTickUnit();

	    	setTickUnit(new DateTickUnit(DateTickUnit.MONTH,1));
	    	state.setTicks(refreshTicks(g2, state, dataArea, edge));

	    	// restore old TickUnit
	    	setTickUnit(tickUnit);

	    	return state;
	    }
	}
Hi,
I have the same need and try to use your solution (thank you for your code).
I obtain the good grid : a vertical line per month, but the tick range isn't dynamic any more ... :
- when the chart is create with a DateTickUnit[MONTH, 1] and when I decrease frame size, the dateTickUnit don't change to DateTickUnit[MONTH, 2]...
- same things when I begin with a DateTickUnit[MONTH, 2] and when I increase the frame...
Is it normal ? Have you an idea how doing this ?
thanks, Tatia34
-
david.gilbert
- JFreeChart Project Leader
- Posts: 11734
- Joined: Fri Mar 14, 2003 10:29 am
- antibot: No, of course not.
- Contact:
A number of people have requested support for major and minor tick units and I think this will require some low-level changes to the NumberTickUnit and DateTickUnit classes, followed by some new code in the NumberAxis and DateAxis classes. It's not a trivial change but I think it is doable...it is something I'd like to have a go at soon.
David Gilbert
JFreeChart Project Leader
 Read my blog
Support JFree via the Github sponsorship program
JFreeChart Project Leader
I just succeed to do it :
- i've passed the DataTickUnit in parametre to the refreshTicks (and refreshTicksHorizontal and refreshTicksVertical) methods.
- I've copy/paste the refreshTicksHorizontal method and instead of get DataTickUnit by the getTickUnit() method.
It's not a really good development but it resolve my problem
- i've passed the DataTickUnit in parametre to the refreshTicks (and refreshTicksHorizontal and refreshTicksVertical) methods.
- I've copy/paste the refreshTicksHorizontal method and instead of get DataTickUnit by the getTickUnit() method.
It's not a really good development
Code: Select all
public class CustomDateAxis extends DateAxis {
    private int dateTickUnit;

    public CustomDateAxis(String label, int dateTickUnit) {
        super(label);
        this.dateTickUnit = dateTickUnit;
    }

    public List refreshTicks(Graphics2D g2,
                             AxisState state,
                             Rectangle2D dataArea,
                             RectangleEdge edge, DateTickUnit unit) {

        List result = null;
        if (RectangleEdge.isTopOrBottom(edge)) {
            result = refreshTicksHorizontal(g2, dataArea, edge, unit);
        }
        else if (RectangleEdge.isLeftOrRight(edge)) {
            result = refreshTicksVertical(g2, dataArea, edge, unit);
        }
        return result;

    }

    protected AxisState drawTickMarksAndLabels(Graphics2D g2, double cursor,
            Rectangle2D plotArea, Rectangle2D dataArea, RectangleEdge edge) {

        AxisState state = super.drawTickMarksAndLabels(g2,cursor,plotArea,dataArea,edge);

        // replace the returned ticks by ticks with the interval dateTickUnit
        state.setTicks(refreshTicks(g2, state, dataArea, edge, new DateTickUnit(dateTickUnit,1)));

        return state;
    }

    protected List refreshTicksHorizontal(Graphics2D g2,
                                          Rectangle2D dataArea,
                                          RectangleEdge edge, DateTickUnit unit) {

        List result = new java.util.ArrayList();

        Font tickLabelFont = getTickLabelFont();
        g2.setFont(tickLabelFont);

        if (isAutoTickUnitSelection()) {
            selectAutoTickUnit(g2, dataArea, edge);
        }

        Date tickDate = calculateLowestVisibleTickValue(unit);
        Date upperDate = getMaximumDate();
        // float lastX = Float.MIN_VALUE;
        while (tickDate.before(upperDate)) {

            if (!isHiddenValue(tickDate.getTime())) {
                // work out the value, label and position
                String tickLabel;
                DateFormat formatter = getDateFormatOverride();
                if (formatter != null) {
                    tickLabel = formatter.format(tickDate);
                }
                else {
                    tickLabel = unit.dateToString(tickDate);
                }
                TextAnchor anchor = null;
                TextAnchor rotationAnchor = null;
                double angle = 0.0;
                if (isVerticalTickLabels()) {
                    anchor = TextAnchor.CENTER_RIGHT;
                    rotationAnchor = TextAnchor.CENTER_RIGHT;
                    if (edge == RectangleEdge.TOP) {
                        angle = Math.PI / 2.0;
                    }
                    else {
                        angle = -Math.PI / 2.0;
                    }
                }
                else {
                    if (edge == RectangleEdge.TOP) {
                        anchor = TextAnchor.BOTTOM_CENTER;
                        rotationAnchor = TextAnchor.BOTTOM_CENTER;
                    }
                    else {
                        anchor = TextAnchor.TOP_CENTER;
                        rotationAnchor = TextAnchor.TOP_CENTER;
                    }
                }

                Tick tick = new DateTick(
                    tickDate, tickLabel, anchor, rotationAnchor, angle
                );
                result.add(tick);
                tickDate = unit.addToDate(tickDate);
            }
            else {
                tickDate = unit.rollDate(tickDate);
                continue;
            }
        }
        return result;

    }

} Re:
How do the DateTickUnit and major and minor ticks work? Is this implemented in version 1.0.13?david.gilbert wrote:A number of people have requested support for major and minor tick units and I think this will require some low-level changes to the NumberTickUnit and DateTickUnit classes, followed by some new code in the NumberAxis and DateAxis classes. It's not a trivial change but I think it is doable...it is something I'd like to have a go at soon.
Kind regards Peter
Re: Ticks and tick labels
Hi, having problems with ticks too. Especially the labels: they don't seem to show up, or not as frequent as I would want them to.
As shown in the image below, the y-axis is using a logarithmic scale, but only shows one label (10).
I've had one case where there were no labels at all.
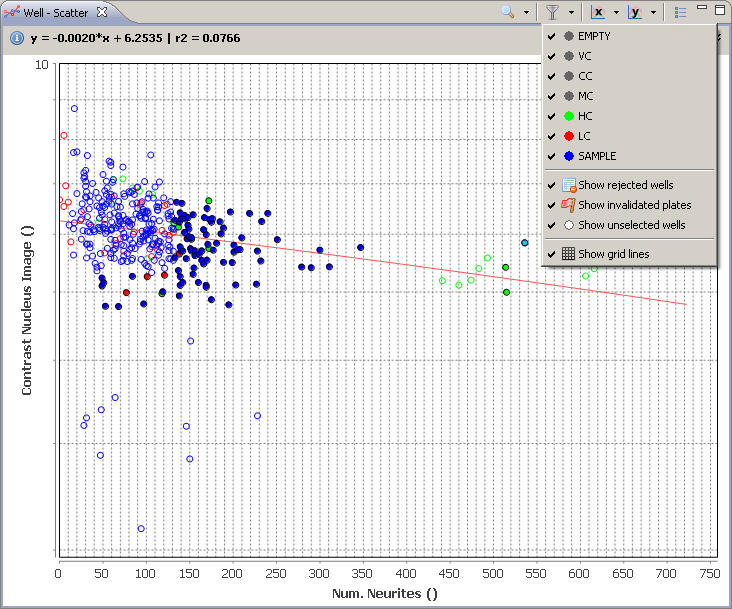
Can the auto-settings be forced to show more labels?
My JFreeChart version is 1.0.13.
Other relevant information can always be provided
PS: thank God for JFreeChart, it has just about everything built-in and customizable.
Writing a data management suite has never been so awesome!
As shown in the image below, the y-axis is using a logarithmic scale, but only shows one label (10).
I've had one case where there were no labels at all.
Can the auto-settings be forced to show more labels?
My JFreeChart version is 1.0.13.
Other relevant information can always be provided
PS: thank God for JFreeChart, it has just about everything built-in and customizable.
Writing a data management suite has never been so awesome!
-HBro
Re: Ticks and tick labels
hbro wrote:Hi, having problems with ticks too. Especially the labels: they don't seem to show up, or not as frequent as I would want them to.
As shown in the image below, the y-axis is using a logarithmic scale, but only shows one label (10).
I've had one case where there were no labels at all.
Can the auto-settings be forced to show more labels?
My JFreeChart version is 1.0.13.
Other relevant information can always be provided
PS: thank God for JFreeChart, it has just about everything built-in and customizable.
Writing a data management suite has never been so awesome!
You could set a fixed maximum but that is not helpful since the maximum is variable... Did you set an TickUnit?
NumberAxis numberAxis = (NumberAxis) plot.getRangeAxis();
numberAxis.setTickUnit(new NumberTickUnit(1, new DecimalFormat("########")));
Maybe try...
http://www.jfree.org/phpBB2/viewtopic.php?f=3&t=27565
HTH Peter ^^
Ps, nice graph!
Re: Ticks and tick labels
I found a sort-of workaround.
First I get the range/domain upperbound of my datasets.
The highest value of these is the absolute upper bound.
If that absolute upper bound < 10, set the axis upperbound to 10.
Too bad the domain axis doesn't like a logarithmic notation:
Gives the result as seen in the screenshot.
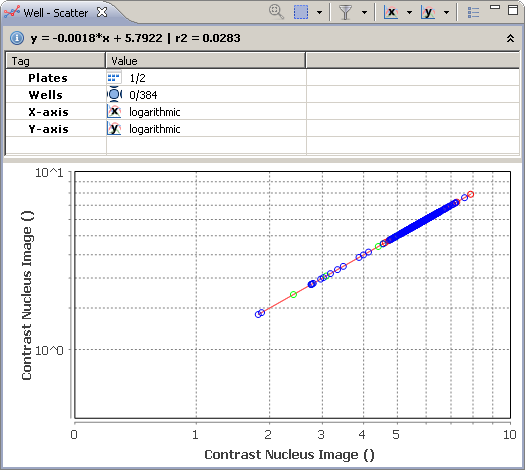
I mean: lol wut?
First I get the range/domain upperbound of my datasets.
The highest value of these is the absolute upper bound.
If that absolute upper bound < 10, set the axis upperbound to 10.
Too bad the domain axis doesn't like a logarithmic notation:
Code: Select all
domainAxis.setLog10TickLabelsFlag(true);I mean: lol wut?
-HBro