A discussion forum for JFreeChart (a 2D chart library for the Java platform).
-
Yoko
- Posts: 4
- Joined: Tue May 04, 2010 9:43 am
- antibot: No, of course not.
Post
by Yoko » Tue May 04, 2010 9:55 am
Hi,
actually i have a problem with the zoom funtion. I can't zoom on my horizontal axis and i don't know why...
Do you have any idea ?

Thx
Sorry for my bad english

-
Yoko
- Posts: 4
- Joined: Tue May 04, 2010 9:43 am
- antibot: No, of course not.
Post
by Yoko » Tue May 11, 2010 10:21 am
No response...

No idea ?
-
jsnel
- Posts: 19
- Joined: Thu Apr 19, 2007 12:00 pm
Post
by jsnel » Tue May 11, 2010 10:44 am
It's not that people don't read your post, or don't want to reply, but without some reproducible example code nobody will be able to have any idea what the problem in your particular case might be. And then what should they write?
Please refer to:
[*]
How to Ask a Question About JFreeChart - READ THIS!
And then, if you still require assistance, try to clarify your post and someone might be able to help you.
Creator of
Glotaran, a software program developed for global and target analysis of time-resolved spectroscopy and microscopy data. Big fan of JFreeChart.
-
Yoko
- Posts: 4
- Joined: Tue May 04, 2010 9:43 am
- antibot: No, of course not.
Post
by Yoko » Tue May 11, 2010 11:44 am
Ok thx and sorry
Here a part of my code, i think the most important where i have my error :
Code: Select all
final CategoryItemRenderer renderer = new BarRenderer3D();
			renderer.setItemLabelsVisible(true);
			final CategoryPlot plot = new CategoryPlot();
	        plot.setDataset(data);
	        plot.setRenderer(renderer);
	        plot.setDomainAxis(new CategoryAxis("Date"));
	        plot.getDomainAxis(0).setTickLabelFont(new Font("Arial",Font.PLAIN,8));
	        plot.setRangeAxis(new NumberAxis("Valeurs Histogrammes"));
	        plot.setOrientation(PlotOrientation.VERTICAL);
	        plot.setRangeGridlinesVisible(true);
	        plot.setDomainGridlinesVisible(true);

	        // Passer l'axe des abscisses en entiers
	        NumberAxis numberAxis = (NumberAxis) plot.getRangeAxis();
	        numberAxis.setStandardTickUnits(NumberAxis.createIntegerTickUnits());

	        // Permet de rajouter un 2eme axe des ordonnées pour la statistique X
	        if(testeur >= 1)
			{
	        	final ValueAxis rangeAxis2 = new NumberAxis("Valeurs Courbes Dispo COPP et FQ (en %)");
	        	plot.setRangeAxis(1, rangeAxis2);

			}
	        plot.setDataset(1, data1);
	        final CategoryItemRenderer renderer2 = new LineAndShapeRenderer();
	        plot.setRenderer(1, renderer2);

	        if(testeur >= 1)
			{
	        	plot.mapDatasetToRangeAxis(1, 1);
			}

	        plot.setDatasetRenderingOrder(DatasetRenderingOrder.FORWARD);
	        plot.getDomainAxis().setCategoryMargin(0.1);
	        plot.getDomainAxis().setCategoryLabelPositions(CategoryLabelPositions.DOWN_90);
	        final JFreeChart chart = new JFreeChart(plot);
	        chart.setTitle("");

	        // Création de la fenêtre avec pour titre la date de début et la date de fin
	        ChartFrame frame1 = new ChartFrame("SYCLOPP L13 ANALYSE du "+date.format(startDate)+" au "+date.format(endDate), chart);
			frame1.setVisible(true);
			frame1.setSize(1000,800);

			}
Thank you very much
-
jsnel
- Posts: 19
- Joined: Thu Apr 19, 2007 12:00 pm
Post
by jsnel » Tue May 11, 2010 1:04 pm
The problem is that you are using a CategoryPlot which uses the CategoryAxis (or CategoryAxis3D in your case) for it's domain axis, and this class does not support zooming. You can only zoom in on the range axis because this uses the NumberAxis class, which does support zooming. So what you are experiencing is expected behavior, not a bug. You could call it a limitation of JFreeChart but I think this is how it was designed to work, because it makes sense.
My guess is that if you really need zooming on the CategoryAxis you are probably trying do display too much data on a limited amount of space. Consider splitting up your data in several plots. Your alternative is to write your own implementation of CategoryAxis with support for zooming.
Creator of
Glotaran, a software program developed for global and target analysis of time-resolved spectroscopy and microscopy data. Big fan of JFreeChart.
-
Yoko
- Posts: 4
- Joined: Tue May 04, 2010 9:43 am
- antibot: No, of course not.
Post
by Yoko » Tue May 11, 2010 1:13 pm
Ok thank you very much !
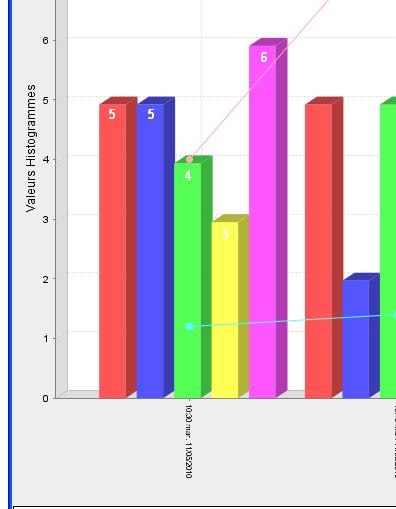
I have an other question, is it possible to show values on the bar ? like that :