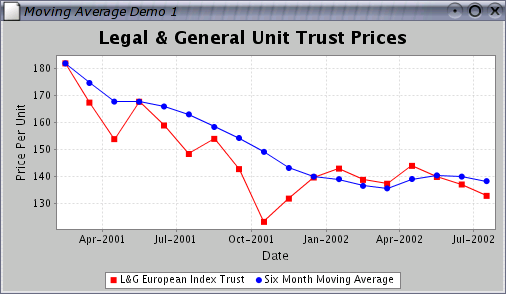
1. As there are a lot of datapoints, adding label to each datapoint make the graph to look congested. So I want to add datapoint to only first week on every month.
2. I want to tilt the label by certain angle so that they do not overlap across time series.
3. I want to use custom colors for the labels.
Any sample code snippet would be highly helpful to me.
