I'm working on a project that includes some fairly simple area and line charts, and selected JFreeChart + Cewolf because of the low barrier to entry and robust configurability. However, at the moment, I've hit something of a wall in finding just the configuration I want. My spec calls for area charts which fill right to the edges of the data area, but I've been unable thus far to figure out how to pull that off. I found the AreaRendererEndType, which looked promising, but setting to TRUNCATE still leaves an unfilled margin on the left and right sides of my data area, and I can't see any difference between setting TAPER and LEVEL.
Perhaps some pictures will make this a bit more clear. What I want is a chart that looks like this:
 .
.What I've been able to get so far is a chart like this:
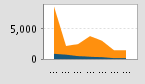 .
. I've seen that JFreeChart can generate charts like what I'm after. The XY Area Chart Demo, for instance, fills right to the edge of the data area. I'm currently using Category datasets, but could shift to XY datasets if that is the only way to get what I'm after. Is that the way for me to go, or is there some other setting which is alluding me? Any help on this would be hugely appreciated. Thanks,
-micah