It's tricky as this is a custmizer for a cewolf servlet.
The customizer could be constructed as:
Code: Select all
String[] wellTypesToDisplay = {
  "production",
  "injection",
  "waste disposal"
};
int numberOfWells = 100;

  DatasetProducer pieTotalsData = new DatasetProducer() {
    public Object produceDataset(Map params) {
      DefaultPieDataset dataset = new DefaultPieDataset();
        dataset.setValue("One", 43.2);
        dataset.setValue("Two", 10.0);
        dataset.setValue("Three", 27.5);
        dataset.setValue("Four", 17.5);
        dataset.setValue("Five", 11.0);
        dataset.setValue("Six", 19.4);

       return dataset;
    }

    public String getProducerId() {
      return "pieTotalsDataProducer";
    }

    public boolean hasExpired(Map params, Date since) {
      return true;
    }
  };
  pageContext.setAttribute("pieTotalsData", pieTotalsData);

KPIPieGraphCustomizer pieTotalsGraphDataPP = new KPIPieGraphCustomizer(kpi, wellTypesToDisplay, numberOfWells);
pageContext.setAttribute("pieTotalsGraphDataPP", pieTotalsGraphDataPP);
Here's a cut down versio of the code for the customizer class:
Code: Select all
import java.text.DecimalFormat;
import java.util.*;
import java.awt.*;
import org.jfree.chart.*;
import org.jfree.chart.block.BlockBorder;
import org.jfree.chart.block.BlockContainer;
import org.jfree.chart.block.BorderArrangement;
import org.jfree.chart.block.LabelBlock;
import org.jfree.chart.labels.PieSectionLabelGenerator;
import org.jfree.chart.labels.StandardPieSectionLabelGenerator;
import org.jfree.chart.plot.*;
import org.jfree.chart.title.LegendTitle;
import org.jfree.chart.title.TextTitle;
import org.jfree.ui.HorizontalAlignment;
import org.jfree.ui.RectangleEdge;
public class KPIPieGraphCustomizer implements ChartPostProcessor {
private String kpi;
private IWITSettings settings;
private int numberOfWells;
private ArrayList<String> wellTypesToDisplay;
public KPIPieGraphCustomizer(String kpi, int numberOfWells) {
this.kpi = kpi;
this.numberOfWells = numberOfWells;
}
public KPIPieGraphCustomizer(String kpi, ArrayList<String> wellTypes, int numberOfWells) {
this(kpi, numberOfWells);
this.wellTypesToDisplay = wellTypes;
}
public KPIPieGraphCustomizer(String kpi, String wellType, int numberOfWells) {
this(kpi, numberOfWells);
ArrayList<String> wellTypes = new ArrayList<String>();
wellTypes.add(wellType);
this.wellTypesToDisplay = wellTypes;
}
public void processChart(Object _chart, Map params) {
JFreeChart chart = (JFreeChart) _chart;
PiePlot plot = (PiePlot) chart.getPlot();
// Chart
plot.setOutlinePaint(null);
// Title
chart.getTitle().setFont(new Font("SansSerif", Font.BOLD, 12));
// Section labels
plot.setLabelGenerator(new StandardPieSectionLabelGenerator("{0} ({2})"));
plot.setLabelBackgroundPaint(new Color(220, 220, 220));
plot.setLabelFont(new Font("SansSerif", Font.PLAIN, 8));
StandardPieSectionLabelGenerator slbl = new StandardPieSectionLabelGenerator(
"{0}={2}",
new DecimalFormat("#,##0"),
new DecimalFormat("0%"));
plot.setLabelGenerator(slbl);
plot.setLegendLabelGenerator(slbl);
plot.setInteriorGap(0.12);
chart.removeLegend();
LegendTitle legend = new LegendTitle(chart.getPlot());
legend.setItemFont(new Font("SansSerif", Font.PLAIN, 10));
BlockContainer wrapper = new BlockContainer(new BorderArrangement());
wrapper.setBorder(new BlockBorder(1.0, 1.0, 1.0, 1.0));
StringBuffer subtitleBuffer = new StringBuffer();
subtitleBuffer.append("(");
boolean needsComma = false;
for(int k=0;k<wellTypesToDisplay.size();k++) {
if(needsComma == true) subtitleBuffer.append(", ");
if(((k+1)%5) == 0) subtitleBuffer.append("\n");
subtitleBuffer.append(wellTypesToDisplay.get(k));
needsComma = true;
}
subtitleBuffer.append(" Wells) = " + this.numberOfWells + " Wells");
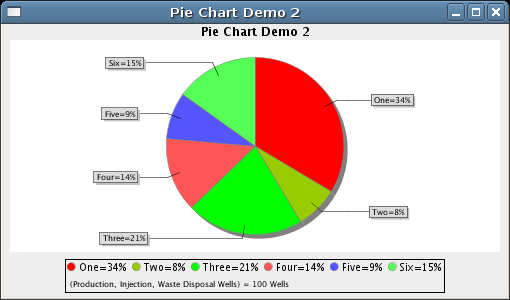
LabelBlock subtitle = new LabelBlock(subtitleBuffer.toString());
subtitle.setFont(new Font("SansSerif", Font.PLAIN, 8));
subtitle.setPadding(5, 5, 2, 5);
wrapper.add(subtitle, RectangleEdge.BOTTOM);
// *** this is important - you need to add the item container to
// the wrapper, otherwise the legend items won't be displayed when
// the wrapper is drawn... ***
BlockContainer items = legend.getItemContainer();
items.setPadding(2, 10, 5, 2);
wrapper.add(items);
legend.setWrapper(wrapper);
legend.setPosition(RectangleEdge.BOTTOM);
legend.setHorizontalAlignment(HorizontalAlignment.CENTER);
legend.setBorder(new BlockBorder(new Color(0,0,0,0)));
chart.addSubtitle(legend);
chart.fireChartChanged();
if(true) {
// RED, AMBER, GREEN
plot.setSectionPaint(0, Color.RED);
plot.setSectionPaint(1, new Color(153, 204, 0));
plot.setSectionPaint(2, Color.GREEN);
}
plot.setNoDataMessage("No data available");
}
}
The jsp to display this would be:
Code: Select all
			<cewolf:chart id="totalsPieChart" title="<%=totalsHeader%>" type="pie">
				<cewolf:colorpaint color="#FFFFFF"/>
    			<cewolf:data>
    				<cewolf:chartpostprocessor id="pieTotalsGraphDataPP"></cewolf:chartpostprocessor>
					<cewolf:producer id="pieTotalsData" />
				</cewolf:data>
			</cewolf:chart>
			<cewolf:img chartid="totalsPieChart" renderer="/cewolf" width="300" height="300"/>
Is this enough?
Thanks
Tony