Small Fractions on Log Charts

A discussion forum for JFreeChart (a 2D chart library for the Java platform).
Locked
paololim
Posts: 11
Joined: Tue Jul 17, 2007 3:08 pm
Location: Hopewell Junction, NY

Small Fractions on Log Charts

Post by paololim » Mon Oct 22, 2007 4:44 pm

I am having problems in displaying negative exponent values for very small fractions on my Logarithmic Axis. 1, 10, 100.... all display correctly. I run into problems when I try to display 1/10, 1/100, etc. I want these to display as: 1e-1, 1e-2, 1e-3, etc. Is there a function I need to call to handle this?

I have the following XYSeries in my dataset:

Code: Select all

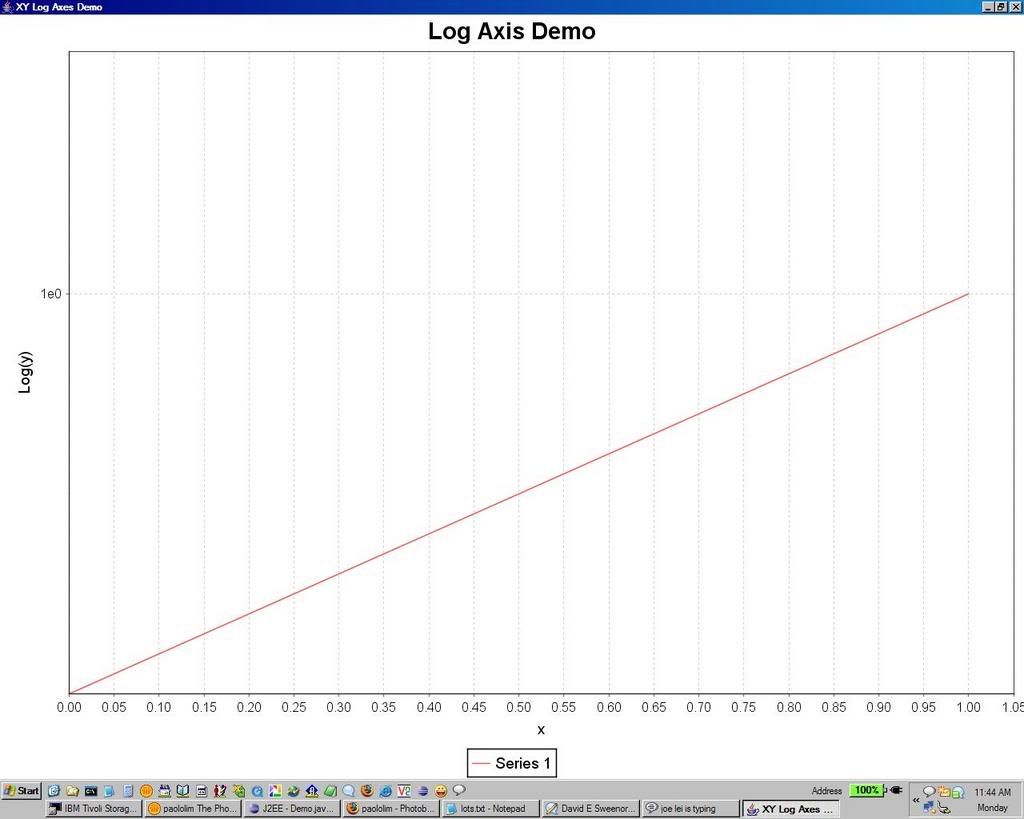
        XYSeries s1 = new XYSeries("Series 1");
        s1.add(0,0);
        s1.add(1,1);
        s1.add(1/10,1/10);
        s1.add(1/100,1/100);
I am configuring my log axis this way:

Code: Select all

        LogarithmicAxis rangeAxis = new LogarithmicAxis("Log(y)");
        rangeAxis.setAllowNegativesFlag(true);
        rangeAxis.setExpTickLabelsFlag(true);
        plot.setRangeAxis(rangeAxis);
The plot I am getting is the following:

Image

petersk
Posts: 8
Joined: Tue Mar 28, 2006 1:03 pm

Post by petersk » Mon Dec 17, 2007 2:36 am

It seems like you didn't get a reply,but I think I have the same problem.
I am trying to plot these values:
X Y
0.1 1.
0.5 1.
1. 0.717
5. 0.5
10. 0.1
50. 0.01
100. 0.005

Using a log scale on the x-axis, I would think I should see 0.1 and 0.5, the same way the higher scales work.

Image

I've looked at the LogarithmicAxis code and it does look like there's a lot of special code for -1<val<1. I just wonder if that's the culprit, and how to fix it.
Regards,
Kurt
Kurt

david.gilbert
JFreeChart Project Leader
Posts: 11734
Joined: Fri Mar 14, 2003 10:29 am
antibot: No, of course not.
Contact:

Post by david.gilbert » Mon Dec 17, 2007 9:52 pm

I don't have much time to look at this right now, but could you try the LogAxis class and see if that makes a difference. LogAxis is a (simpler) alternative implementation to the original LogarithmicAxis class.
David Gilbert
JFreeChart Project Leader

:idea: Read my blog
:idea: Support JFree via the Github sponsorship program

petersk
Posts: 8
Joined: Tue Mar 28, 2006 1:03 pm

Post by petersk » Tue Dec 18, 2007 1:08 am

It would seem LogAxis does the job right. Should I be concerned about putting it in "production code"?
Image

David,
On a side note, have you seen code out there that let's the user REMOVE annotations like that one at [1, 0.72]?
Regards,
Kurt
Kurt

paololim
Posts: 11
Joined: Tue Jul 17, 2007 3:08 pm
Location: Hopewell Junction, NY

Post by paololim » Thu Dec 20, 2007 12:25 pm

Which version of JFree is LogAxis on? It seems to be experimental in mine. Is there any particular reason why a new LogAxis class was created and some things seem to be different from LogarithmicAxis?

petersk
Posts: 8
Joined: Tue Mar 28, 2006 1:03 pm

Post by petersk » Sun Dec 30, 2007 3:41 am

I'm using the latest release. I'm not sure if it's marked experimental in that release (I haven't bothered to check).
Kurt
Kurt

paololim
Posts: 11
Joined: Tue Jul 17, 2007 3:08 pm
Location: Hopewell Junction, NY

Post by paololim » Thu Jan 24, 2008 2:55 pm

Ok, I've tried playing around with LogAxis. I'm not sure if anyone else is running into the problems I have with it. Right now, everytime I manually call setRange() or setRangeWithMargins(). I don't know if any other method is affected. I always run into an out of memory for heap error. I have never received anytthing like this for the old LogarithmicAxis, but that doesn't seem to work in other ways too.

Has anyone else received this error? Is ther a workaround?

Exception in thread "AWT-EventQueue-0" java.lang.OutOfMemoryError: Java heap space

dlucas
Posts: 19
Joined: Sat Dec 29, 2007 5:07 am
Location: Boston (USA)

Post by dlucas » Sun Jan 27, 2008 3:22 am

I don't know if this helps, but it is important when graphing data on log axes to control the minimum displayed value. Otherwise, an autoranging axis can produce unexpected numbers of decades. I am not having problems with my log axes using LogAxis (I haven't tried LogarithmicAxis) and the following code:

LogAxis yAxis = new LogAxis("Amps");
yAxis.setNumberFormatOverride(new LogFormat(10.0, "10e", true));
yAxis.setSmallestValue(0.1); // this prevents excessive numbers of decades when small numbers are present
plot.setRangeAxis(yAxis);

The only discrepancy that I have noticed is that in addition to using my text string of "10e", an up caret ("^") is concatenated onto the end of my chosen "10e" that I was not expecting.

I would post a picture, but I don't have access to an appropriate http server.

Don
Best regards,

Don

Locked